
Android Studio 2.4 Preview 2 : Android Profiler, Semantic Highlighting
Android Profiler in Android Studio 2.4 preview — Android Studio Project SiteThe new Android Profiler window in the Android Studio 2.4 preview replaces the Android Monitor. The advanced profiling tools display realtime data updates for CPU, memory, and network activity.
The default view in the Android Profiler window, as shown in figure 1, displays a simplified set of data for each profiler. You must first select (1) the device and (2) the app process you want to profile. You can then click one of the graphs to see the more detailed timeline. Every view also includes (3) timeline zoom controls, (4) a button to jump to the realtime data, and an (5) event timeline that shows the lifecycle of activities and see all input events and screen rotation events.
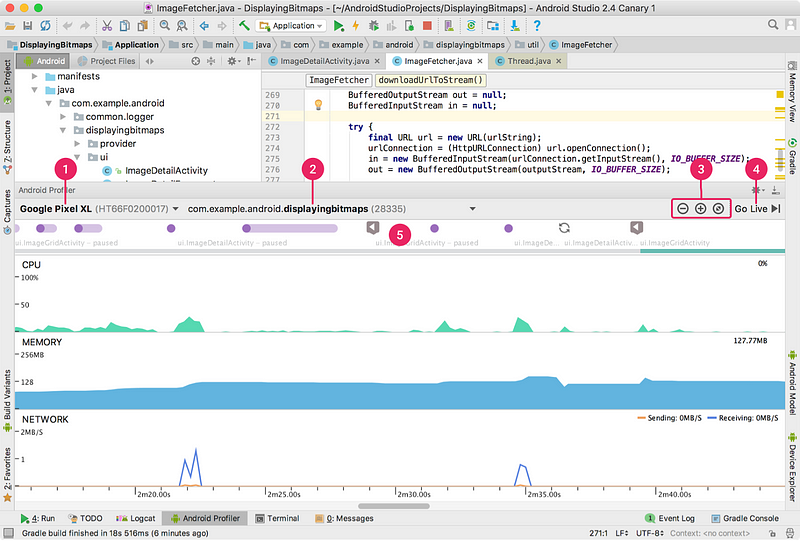
Figure 1. The Android Profiler overview, showing the timeline for all profilers
CPU Profiler
The CPU Profiler shows realtime CPU usage for your app process and system-wide CPU usage on a timeline.
You can select between (1) a traditional instrumented trace (method traces) and a sample-based trace. Then click (2) Record to begin tracing your code. Once you’re done recording, the timeline indicates (3) the captured region, you can (4) view the state of each thread, and (5) see either a top-down list, bottom-up list, or flame chart for the methods that have executed during the recording.
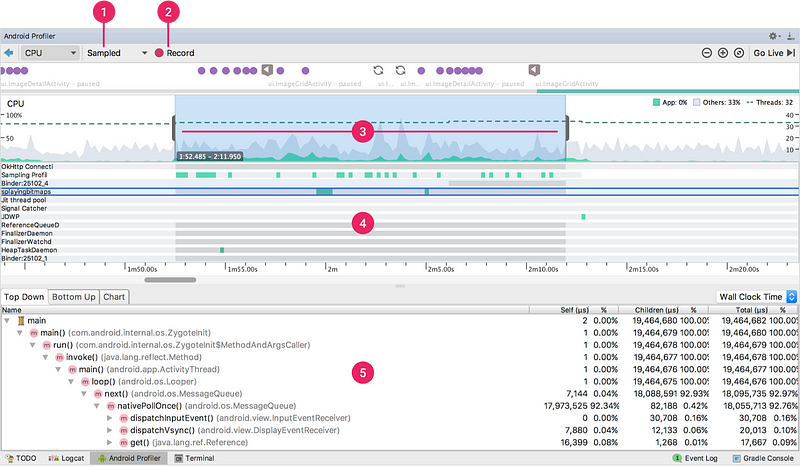
Figure 2. The CPU Profiler, with results from sampled method tracing
Memory Profiler
The Memory Profiler view combines the features from Heap Viewer, Allocation Tracker, and Memory Monitor, so you can view realtime count of allocated objects and garbage collection events on a timeline, capture heap dumps, and record memory allocations, all from one interface.
The Memory Profiler shows the amount of memory used by your app on a timeline, according to the memory size on the left y-axis. Each memory type (such as Java, Native, and Graphics) is indicated with a different color in a stacked graph. The total number of objects allocated by your app is indicated with a dotted line, according to the y-axis on the right. Values for each are also specified in a key at the top of the graph.
The toolbar at the top of the window allows you to (1) Force garbage collection, (2) Capture a heap dump, and (3) Record memory allocations.
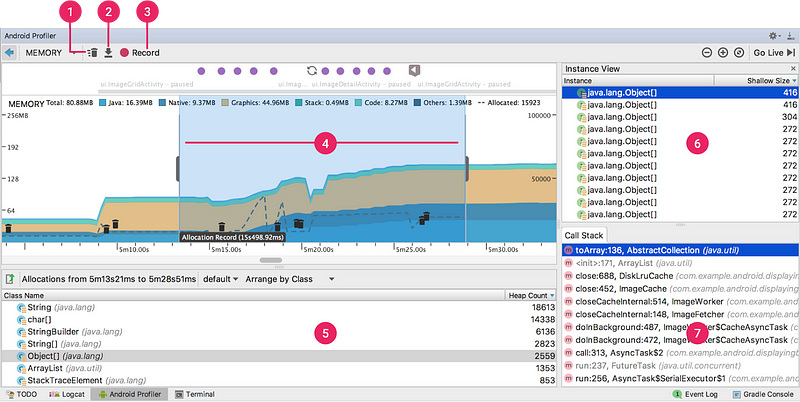
Figure 3. The Memory Profiler, with results from a memory allocation recording
When you capture a heap dump or record memory allocations, the (4) recording event is indicated on the timeline. Your results then appear in (5) the pane below the timeline. In figure 2, this window shows the memory allocation results during the time indicated in the timeline. When viewing either a heap dump or memory allocations, you can select a class name from this list to view the (6) list of instances on the right. Clicking an instance there, reveals (7) a third pane below, showing either the stack trace for where that memory was allocated (when viewing the allocation record), or the remaining references to that object (when viewing a heap dump).
You can also capture a heap dump while memory allocation tracking is turned on to get stack traces in the heap dump (for objects allocated after allocation was turned on).
Network Profiler
The Network Profiler displays realtime network activity on a timeline, showing data sent and received, as well as the current number of connections. At the top of the window, you can see the event timeline and (1) radio power state (high/low) vs Wi-Fi.
On the timeline, you can (2) click and drag to select a portion of the timeline to inspect the traffic. The (3) window below then shows files sent and received during the selected portion of the timeline, including file name, size, type, status, and time. You can sort this list by clicking any of the column headers. You also see a detailed breakdown of the selected portion of the timeline, showing when each file was sent or received.
Click a file name to view (4) detailed information about a selected file sent or received. Click the tabs to view the response data, header information, or the call stack.
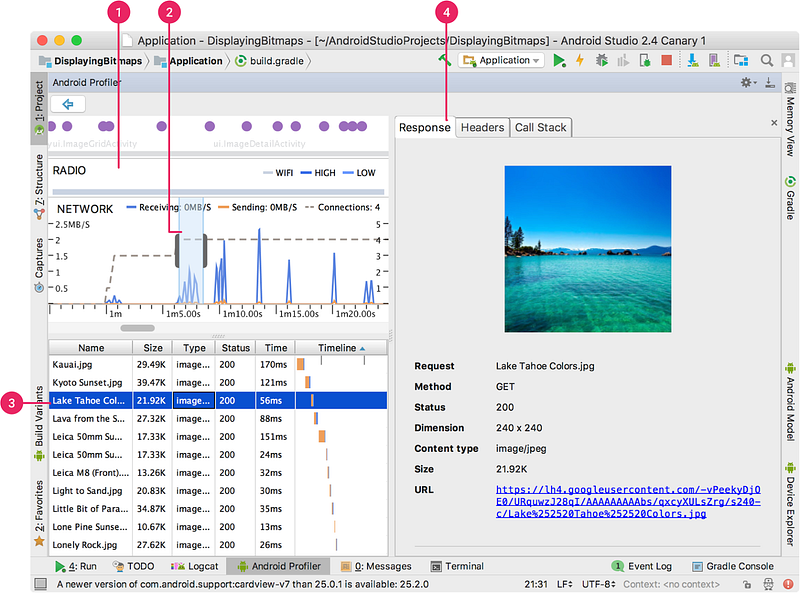
Figure 4. The Network Profiler, showing a network request and the response
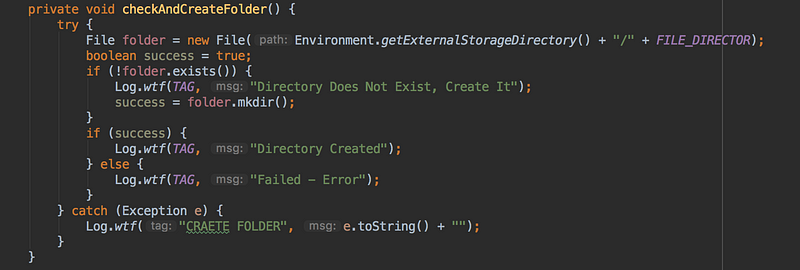
Enable Semantic Highlighting
Android Studio 2.4 Preview 1 comes with a very cool feature from IntelliJ: Semantic Highlighting. This is how you can activate it.


No comments: